118
Views & Citations10
Likes & Shares
The Lake Tana Basin supports various livelihoods and economic activities, the major ones being crop, livestock and fish productions [3]. The government of Ethiopia considers the Lake Tana Basin an important area for development given its water resource potential that can support various economic activities for both the region and country [4]. As such, since 2015, various mega hydro-power and irrigation projects are being constructed in almost all tributary rivers of the basin including the GERD [5].
Lake Tana Basin also serves as a rich source of fish which is an important means of livelihood. This is evident as Lake Tana is home to 21 fish species that are endemic to Ethiopia and fish production can reach up to 13,000 tons per annum but the current production is only 1,000 tons per year [6]. Thus, there is a huge potential to exploit in terms of fish production which could lead to large-scale exports to the international market [7].
Agricultural crop production is another important economic sector and source of livelihood in the Lake Tana Basin system. There is high crop diversity in the basin consisting of major crop categories that include cereals, legumes, root crops, oil crops, vegetables, fruit crops and other cash crops [8]. The major crops that are grown in the basin generally cover at least half a million hectares of land [9]. Moreover, there are large arable land and water resources that can be used for expansion of the current irrigated agriculture. However, despite the existence of these resources, the development of irrigated agriculture remains low and production is still subsistence and rain-fed. In fact, about 80 percent of the cultivated land in the basin is under rain-fed system, only the rest being cultivated using irrigation and residual moisture [10].
On the other hand, studies indicate that this important basin is experiencing climate change. It has been observed that there is decline in water yield [11]. For example, the total water yield of the Lake Tana Basin declined by 6.5 percent due to climate change [12]. Another recent study by Ketema [13] reveals that the Lake Tana Basin is highly susceptible to climate change induced shocks. Besides the challenges posed by climate change, the basin is faced with myriads others including but not limited to rapid population growth, land degradation, forest resource destruction, energy shortage and ecological damage [14]. In addition, the fish production in Lake Tana is being affected by climate change (fluctuation of rainfall, temperature, and humidity) and anthropogenic activities (overgrazing, deterioration of wetlands, recession agriculture and agricultural influential) in the area, resulting in declining fish variety and production rate [15].
Previous empirical studies have shown that climate variability affects crop production [16-23]. However, there are three major gaps in the literature in Ethiopia. First, the modelling of climate change crop production is aggregate and not area specific which is in need important when one consider countries like Ethiopia where their diverse climate and agro-ecology even within the same Kebele. Second, studies conducted in the Tana basin are cross sectional and as such they have very little to say about the long run impact and relationship between crop production, productivity and climate change. Third, studies in the lake Tana basin mainly focused on the hydro-logical impact of climate change than agriculture related factors.
MATERIALS AND METHODS
Study area
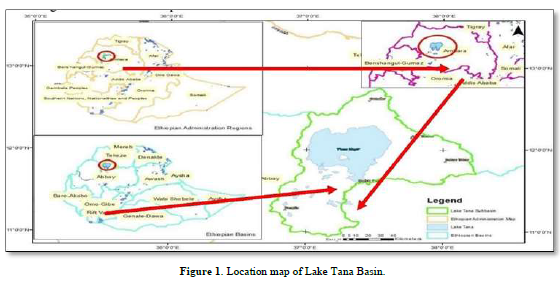
The Lake Tana Basin is located in the Amhara regional state of Ethiopia (12° latitudes 10.95° and 12.78°N, and longitude 36.89° and 38.25°E), stretching to around 15,096 km2 and contributing about 85percent of the annual flow of Nile River [22]. The basin is the largest lake in the country and the third largest in the Nile Basin river system [23]. Interestingly, Lake Tana is the major water source for the Blue Nile river which accounts for 85 percent of the water in the Nile river. This makes Lake Tana Basin an important political and economic center both for the country and the Nile basin system (Figure 1).

Data source
The major secondary data sources are, Ethiopian National Meteorological Agency (ENMA), Central Statistical Agency (CSA) and Ethiopian Economics Association (EEA) database. In order examine climate change and variability over time there is a need to examine the pattern in climate change variables over time and at least a 30-year data is required to claim any sort of climate variability [19,20]. As such, the sample size of the datasets runs from 1989‐2019. The study used annual and monthly rainfall and temperature data collected by the meteorological stations at the Lake Tana Basin, gathered by ENMA.
The growth model applied for the Ethiopian by incorporating rainfall variability in crop production as a major determinant. The effect of other factor such as fertilizer, labor, area, consumption etc. has also been controlled in the model. The crop sector composed of the five major crops grown in the basin (teff, maize, wheat, barley and rice). The Cob Douglas type production function for the value of crop production has been taken adjusted for Ethiopian case and transformed into log form in Equation (2) so coefficients will be in their elasticities. In addition to conventional determinants of crop production, autoregressive and moving average variables have also been captured in to the model in Equation (3) to make the model dynamic. To correct for simultaneity bias, the lead and lag of regressors have been incorporated.
There are about ten-gauge stations situated in the upper and lower basins of Lake Tana. However, two stations, one from upper basin and another from the lower basin, provided reliable and accurate data for the time series weather data analysis. These stations were the Bahir Dar station from the lower basin and the Debretabor station from the upper basin. These stations provided complete data at least for 30 years. In this regard, other studies have also indicated that data from these two stations are reliable and complete [22,23].
The data was analyzed using simple descriptive statistics which includes the calculation of standard deviations (SD), mean, coefficient of variability (CV), Mann Kendall trend test and Precipitation Concentration Index (PCI). In addition, the Stock, [20,21] Dynamic OLS estimation technique has been used. This technique was chosen since it has some advantage compared to other time series models for three main reasons. These are ;1) it is robust in the context of a small sample size, 2) appropriate to estimate co‐integrated variables of different order, and 3) it can correct simultaneous and small sample bias by inclusion lead and lag of variables and shares the asymptotic properties of Johansen and Juselius multivariate analysis [23].
Modelling crop production and climate variability in the Lake Tana Basin
In order to understand the interaction between crop production and rainfall pattern in the Lake Tana Basin, a dynamic ordinary least square (OLS) regression model is used. The dynamic OLS estimation technique has been used. This technique has three advantages relative to other time series models: 1) it is robust in the context of a small sample size, 2) corrects simultaneous bias, and 3) corrects small sample bias [20]. The basis for the theoretical framework is the traditional Ramsey growth model adjusted for the Ethiopian context by incorporating rainfall variability and temperature data within crop production as a major determinant. The effect of other factors such as quantity of fertilizer and land etc. has been controlled in the model.
The Cob Douglas production function for cereal crop production has been adjusted for the Ethiopian case and transformed into log form in Equation (3). The following time series model is created to capture the relationship between climate variables and crop production based on the work of [21].
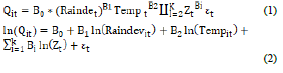
The above equation further changed by adding additional regressors (with their leads and lags) to Equation three. Moreover, equation three presented the logarithmic form of regressors.
Where:
Qit: Value added crop production at time t; Raindevit: Deviation of rainfall from its mean for crop at time t; Areacultiit: Total area cultivated at time t; Tempit: Deviation of temperature from its mean for crop i at time t, Land cultivated at time t; Fertiit: Quantity of fertilizer used at time t; LFit: Labor engaged in crop production at time t; AR(1): Autoregressive variable; eit: Random error term; t: (1989-2019)
RESULT
Trend in rainfall, temperature and crop production
Before looking into the trend in the rainfall data, there is a need to examine the descriptive statistics of the data. The descriptive statistics for the monthly aggregated rainfall data are calculated for the period between 1989 and 2019. The result of the descriptive statistics summary shows that the top 4 maximum rainfall levels as well as the top 4 highest mean rainfall levels were recorded for the months of June, July, August, and September (annex A). The same table also shows that the highest mean monthly rainfall is 489.72mm and the highest maximum rainfall is 765 mm, both recorded in the same month of July. Moreover, from this table it can concluded that the lower basin of Lake Tana Basin gets most of its rain during the summer season (June, July, August and September).
In the same manner, the descriptive statistics for the upper Lake Tana Basin is presented in annex B. The analysis summarizes the mean monthly aggregated rainfall data for the period between 1989 and 2019. The result shows that the top 4 maximum rainfall levels for the upper basin were recorded for June, July, August, and September with amounts of 345mm, 592.1mm, 628.5mm and 321mm respectively. The table also shows that the top 4 highest mean annual rainfall data is recorded for the same months of June, July, August and September with amounts of 151.7mm, 396.59mm, 375.94mm and 188.5 mm respectively. The table also shows the driest months in the basin are January, February and March. The result confirms that there is a similarity between the two stations (upper and lower basin) in terms of months with highest rainfall.
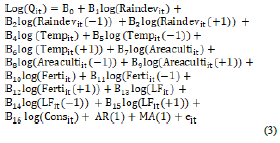
The trend in the annual rainfall data for the lower Lake Tana Basin is presented in Figure 2. The trend analysis shows how the annual rainfall data behaved for the 30-year period between 1989 and 2019. The result shows a decreasing trend in annual rainfall with a strong annual rainfall variability that can also be seen in the trend line equation given by the equation. This equation has at least two important implications: 1) it shows the existence of a decrease in rainfall that is indicated by the negative slope (-3.25) of the equation, and 2) the shows the variation due to the independent variable in the model is 5 percent.
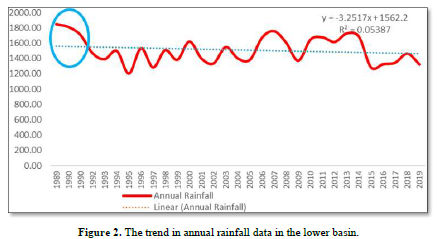
The trend in rainfall data obtained from station in the upper basin of Lake Tana Basin is presented in Figure 3. As is the case for the lower basin, the result in Figure 3 shows a decreasing trend in annual rainfall for the upper basin. This can be seen from the trend line equation given by the formula The equation’s slope (-7.29) indicates a decreasing trend and the value for shows that the variation in the dependent variable is 10 percent.
The trend in annual rainfall for the lower and upper basin is presented together in Figure 4. As the slope of the coefficients of the linear trend estimation indicates, there is a decline in the volume of rainfall both in the lower and upper basins of the Lake Tana Basin. From Figure 4, it can be said, the trend in annual rainfall was erratic for both basins. Moreover, from the regression coefficient, annual rainfall has declined by an average of 7.2mm and 3.2mm for the lower basin (-7.2914x + 1606.6) and the upper basin (-3.2517x + 1562.2) respectively. Thus, for every additional year we can expect rainfall to decline by an average of 7.2mm and 3.22mm for the lower basin and the upper basin respectively.
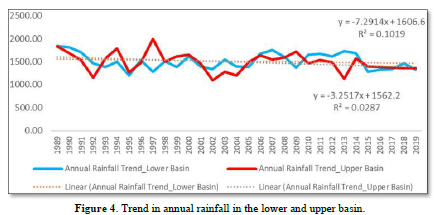
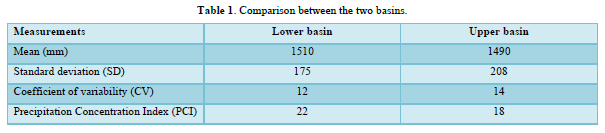
Table 1 summarizes the mean, standard deviation and coefficient of variation and Precipitation Concentration Index (PCI) for both the lower and upper basins of the Lake Tana Basin system. The result that the mean rainfall is 1510mm and 1489.9mm in the lower and upper basins respectively. And the coefficient of variability (CV), which is obtained by dividing standard deviation by mean value and multiplying by 100, is 12 mm and 14 mm in the lower and upper basins respectively (Table 1). Accordingly, the result in table 5.3 shows that there is low rainfall variability both in the lower and upper basins. However, other studies have indicated that there is high rainfall variability (inter-annual variability of rainfall distribution) when one considers the different seasons separately [18]. The implication is that there is a need to consider multiple aspects of rainfall variability measurements.

Table 1 also shows Precipitation Concentration Index (PCI) values. According to Hundera, Mpandeli & Bantider (2019), this value can be interpreted in four ways: 1) if the value of PCI is less than 10, it shows the existence of uniform distribution of precipitation, 2) if it lies between 11 and 15, it shows moderate precipitation concentration, 3) if it lies between 16 and 20, it shows irregular distribution of precipitation, and 4) if it is greater than 20, it can be interpreted as strong irregularity of precipitation (high concentration). The PCI is greater than 20 for the lower basin which indicates irregular precipitation and it is between 16 and 20 for the upper basin which indicates strongly irregular precipitation (Table 1). The implication is that both the upper and lower basins are experiencing changes in rainfall pattern which is a key indicator of climate change in the area. This has an implication for the community as most depend on agriculture which as noted earlier is the most sensitive sector when it comes to climate change.
The descriptive statistics for the monthly temperature data of the lower and upper basins of the Lake Tana Basin system is presented in annex C and D respectively. The result for the lower basin in annex C shows that the top 3 highest maximum temperatures are recorded for the months of April, May and June with values of 24°C, 27°C and 25°C. The same table shows that the highest mean temperature was recorded in the month of May. Moreover, the highest variations of mean monthly temperature were recorded for the months of December and March.
Similarly, for the upper basin, appendix D reveals that the top 3 highest mean temperatures were recorded for the months of March, April and May with values of 17.5°C, 17.3°C and 17.2°C respectively and the top 3 maximum temperatures were recorded for the same months of March, April and May with values of 24.4°C, 19.7°C and 19.1°C respectively. The same table shows that the highest coefficient of variation was recorded for the month of December.
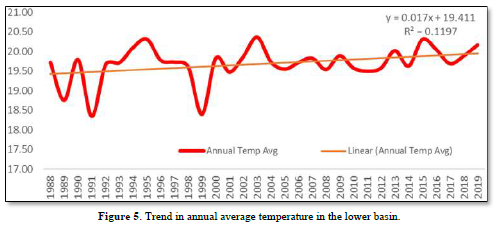
The time series mean monthly temperature was analyzed for the period of 30 years ranging from 1989 to 2019. The data for the analysis came from two stations, one from the upper basin (Debretabor station) and the other from lower basin (Bahir Dar station). According to the results in Figures 5 & 6, the fitted linear trend line for the lower basin shows the existence of an increasing trend in temperature in the basin and this is reflected by the positive coefficient of the slope of the linear equation. Likewise, the result for the upper basin also reveals the existence of an increasing trend in the mean temperature in the period considered. The positive coefficient of the slope of the fitted linear equation indicates this rising trend.

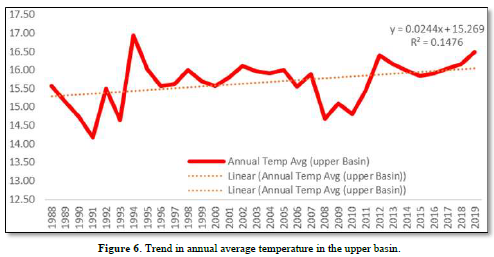
From Figures 5 & 6 it can be observed that the relative increase in temperature was gradual. Moreover, from the regression coefficient, annual temperature has increased by an average of 0.01°C and 0.02°C for the lower basin (y = 0.017x + 19.411) and the upper basin (0.0244x + 15.269) respectively. Thus, for every additional year we can expect temperature to increase by an average value of 0.01°C and 0.02°C for the lower basin and upper basins respectively.
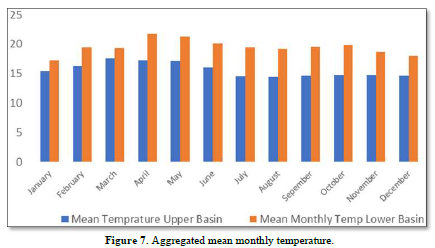
Moreover, Figure 7 shows the aggregate mean monthly temperature data for lower and upper basin stations of the Lake Tana Basin. The chart generally indicates that the values of aggregated mean monthly temperature data in the lower basin tend to be greater than the values in the upper basin. The same figure also shows that the top 2 highest mean monthly temperatures were recorded for the months of April and May both for the lower and upper basins.

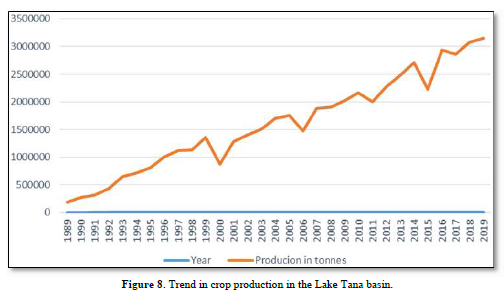
On the other hand, agriculture is an important source of livelihood for community members in both the lower and upper basins. Thus, there is a need to examine the relationship between climate change variables and crop production. The trend in the following figure shows that there is variability in crop production over the period considered. This has been especially observed for the periods 2000/2001, 2006/07, 2011/12 and 2015/2016. Other studies have also indicated that these periods were characterized by severe droughts [19] (Figure 8).

Time series analysis
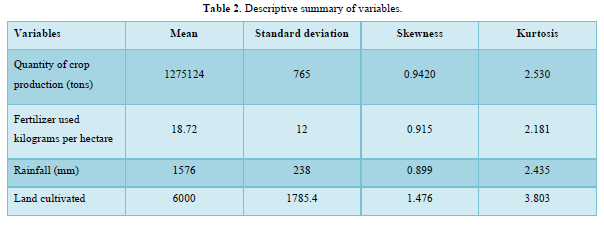
In many instances, multivariate time-series data is non-stationary. Thus, descriptive analysis is important to understand the properties and the behavior of the study variables before estimating the time series model. In this regard, the result in Table 2 shows that all variables included in the model have less standard deviation than the mean values; this indicates the normality of the variables. Moreover, to avoid the variation of the variables as well as homogeneity, variables are changed to their logarithmic form.

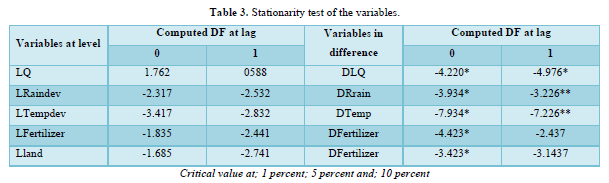
In a multivariate time-series model, one should check the stationarity of the variables using the Dickey-Fuller (DF) unit root test. This test can be used both at level and first difference form. If variables are non-stationary at level but stationary at first difference, we will use vector error correction model. As the result of Table 3 shows, all the variables are none stationary at level. However, they are all stationary at 1 percent level of significance in their first difference form.
After controlling the impacts of cultivated area and fertilizer, the impact of rainfall and temperature has an expected sign in the crop equation. The result of the estimated model is given in table 4. The result shows that a 1 percent increase in temperature will lead to a decrease in cereal crops production by 2.2 percent. In the case of rainfall, a 1 percent increase in rainfall divergence from its optimal level will lead to a decrease in cereal crops production by 0.23 percent. When the annual rainfall diverges from its mean (both upward and downward), the level of production of crop diminishes significantly. Thus, it is not the amount of rainfall per se that matters but how that rainfall diverges from its optimal level. However, other empirical studies that used actual amount of rainfall (than the mean deviation) found a positive and significant impact of rainfall on farming in Ethiopia [21].
The result in the same table shows that a 1percent increase in fertilizer consumption per arable land increases crops production by about 0.35 percent in the long run. This result is consistent with the empirical findings of Gebregeorgis [22] who reported a positive and significant effect of fertilizers on agricultural crop production in the long run.
In the long run, the coefficient of arable land indicated a positive and significant effect on cereal crops production, as a 1 percent increase in the area of arable land increases cereal crops production by 1.82 percent in the long run. This implies that cereal crops production is highly responsive to changes in the area cultivated which is consistent with the empirical research findings of Block (2008) (Table 4).
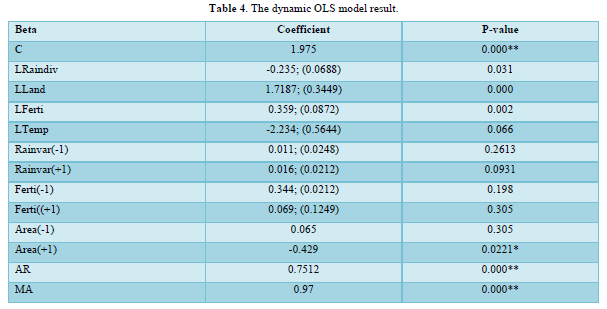
The coefficient of temperature shows that a 1 percent increase in temperature decreases crop production by 2.2 percent. Thus, temperature has a significant negative effect on cereal crops production. This result is consistent with conclusions made by Hariis [23].
The post estimation for the Dynamic OLS is presented in annex G. Based on the heteroscedasticity test (White’s Heteroskedasticity) output, the prob>chi2 value is 0.643. Based on the hypothesis that has been created (Ho: constant variance), the results of the hypothesis testing indicate that the null hypothesis is accepted (p-value is greater than 0.05). Thus, it can be concluded that the residual variance is constant (homoscedasticity). Also, the Breusch‐Godfrey serial correlation test shows based on the hypothesis that has been created (Ho: there is no serial autocorrelation in the model), the null hypothesis is accepted (p-value is greater than 0.05). Thus, there is no serial autocorrelation in the model. The same table indicates that the error term in the model is normally distributed (Jarque- Bera test).
CONCLUSION
The analysis of climate change variables involved different statistical measurements including descriptive statistics and regression model. The time series mean monthly temperature and rainfall was analyzed for the period of 30 years ranging from 1989 to 2019/2020. The result shows the existence of an increasing upward trend in mean temperature in the Lake Tana Basin. In addition, the separate results for the upper and lower basin also reveal the existence of an increasing upward trend in the mean temperature in the period considered. In addition, the rainfall data obtained from both the lower and upper basin satiation of the Lake Tana Basin shows a decreasing trend in annual rainfall.
The relationship between crop production and climate change examined for the period between 1989 to 2019/20 using a dynamic OLS model. The result shows the existence of relationship between cereal crop production and climate variables. The result of the model shows while rainfall and temperature have a significant negative effect on cereal crops production, fertilizer consumption and land cultivated have the exact opposite effects.
POLICY IMPLICATIONS
Climate change variability has a negative impact crop production in the Tana basin agriculture system of Ethiopia where millions of rural farmers rely on rain for crop production. Thus, there is a need to design specific adaptation measures to reduce the vulnerability crop-based livelihoods in the area. Moreover, since climate change crop has an impact on staple crops production (annual crops), the effect could also have repercussion for the food security conditions of millions of farmers in the Lake Tana basin livelihood system. In this regard, there is a need to integrate crop-based adaptation measures with local food systems-based adaptation measures.
- Chandio AA, Jiang Y, Amin A, Akram W, Ozturk I, et al. (2021) Modeling the impact of climatic and non-climatic factors on cereal production: Evidence from Indian agricultural sector. Environ Sci Pollut Res 29: 45-70.
- Abera M, Krystyna S, Goraw G, Shimelis A (2017) Agriculture in the Lake Tana Sub basin of Ethiopia Springer. pp: 375-397.
- Addisu S, Fissha G, Gediff B, Yemane Y (2019) Perception and adaptation models of climate change by rural people of lake Tana Sub-Basin Ethiopia. J Environ Syst Res 5: 231-234.
- Addisu S, Yihenew S, Getachew F, Birhanu G (2015) Time series trend analysis of temperature and rainfall in lake Tana Sub-basin, Ethiopia. J Environ Syst Res 4: 1-25.
- Asmare E, Demissie S, Tewabe D, Endalew M (2016) Impact of climate change and anthropogenic activities on livelihood of fishing community around Lake Tana Ethiopia. JEC Cronicon Agric 3: 548-557.
- Dejen E, Anteneh W, Vijverberg J (2017) The decline of the lake Tana fisheries: Causes and possible solutions. Land Degrad Dev 28: 1842-1851.
- Ginbo T (2022) Heterogeneous impacts of climate change on crop yields across altitudes in Ethiopia. Clim Change 170(12): 1-15.
- Goshu G, Aynalem S (2017) Problem overview of the Lake Tana Basin. in social and ecological system dynamics characteristics, trends, and integration in the Lake Tana Basin, Ethiopia, edited by S Krystyna G Goraw & A Shimelis. London Springer; pp: 9-23.
- Hayelom B, Chen Y, Marsie Z, Negash M (2017) Temperature and Precipitation Trend Analysis over the last 30 years in Southern Tigray regional State Ethiopia. J Atmos Pollut 5: 18-23.
- Hayakawa K, Kurozumi E (2008) The role of leads in the dynamic OLS estimation of cointegrating regression models Mathematics and Computers in Simulation (MATCOM). Elsevier 79: 5-15.
- Jones PG, Thornton PK (2003) The potential impacts of climate change on maize production in Africa and Latin America in 2055. Glob Environ Change 13: 51-59.
- Kassahun A (2015) The impact of climate variability on crop production in Ethiopia: which crop is more vulnerable to rainfall variability. Available online at: https://eea-et.org/wp-content/uploads/2023/03/Kassahun-Aberra_The-Impact-of-Climate-Variability-on-Crop-Production-in-Ethiopia.pdf
- Ketema A (2020) Determinants of agricultural output in Ethiopia ARDL approach to Co-integration. Int J Bus Soc Sci 10: 1-10.
- Misganaw K, Getu A (2016) Marketing and livelihood contribution of fishermen in lake Tana, North Western part of Ethiopia. Fish Aquac J 7: 3-7.
- Moat J (2017) Resilience potential of the Ethiopian coffee sector under climate change. Nat Plants 3: 17081.
- Rahn E, Vaast P, Läderach P, van Asten P, Jassogne L, et al. (2018) Exploring adaptation strategies of coffee production to climate change using a process-based model. Ecol Model 371: 76-89.
- Ray DK, West PC, Clark M, Gerber JS, Prishchepov AV, et al. (2019) Climate change has likely already affected global food production. PLoS One 14: 137-148.
- Setegn SG, Rayner M, Melesse B, Srinivasan R (2011) Impact of climate change on the hydroclimatology of Lake Tana Basin, Ethiopia. J Water Resour Res 47: 1-13.
- Solomon A, Adesola O, Sulaiman H, Rao P (2010) Determinants of adaptation strategies to climate change among the smallholder farmers in Adama District Ethiopia. Int J Clim Change Strateg Manag 7: 463-476.
- Taye M (2021) Agro ecosystem sensitivity to climate change over the Ethiopian highlands in a watershed of Lake Tana sub basin. Heliyon 7: 1-9.
- Yitbarek M, Belay M, Bazezew A (2019) Determinants of manual control of water Hyacinth expansion over the lake Tana Ethiopia. Int J Sci Technol 8: 1-14.
- Gebregeorgis E, Robertson K, Zhou P, Gao P, Williams P, et al. (2020) Historical droughts recorded in extended Juniperus procera ring-width chronologies from the Ethiopian Highlands. Int J Biometeorol 64: 739-753.
- Hariis R, & Solis R (2008) Applied Time Series Modeling and Forecasting John Wiley Sons Ltd.
-
 Table 1
 -
Table 2
-
Table 3


QUICK LINKS
- SUBMIT MANUSCRIPT
- RECOMMEND THE JOURNAL
-
SUBSCRIBE FOR ALERTS
RELATED JOURNALS
- Journal of Astronomy and Space Research
- Journal of Veterinary and Marine Sciences (ISSN: 2689-7830)
- Journal of Microbiology and Microbial Infections (ISSN: 2689-7660)
- Journal of Genomic Medicine and Pharmacogenomics (ISSN:2474-4670)
- Journal of Genetics and Cell Biology (ISSN:2639-3360)
- Journal of Biochemistry and Molecular Medicine (ISSN:2641-6948)
- Proteomics and Bioinformatics (ISSN:2641-7561)